Dashboard
Welcome to your DentalFlo dashboard! This is where you can check how your virtual receptionist is doing—how many calls and messages your clinic has handled, how many bookings you've got, and how many new patients came through.
Top Summary at a Glance
Right at the top of your dashboard, you'll see four key numbers:
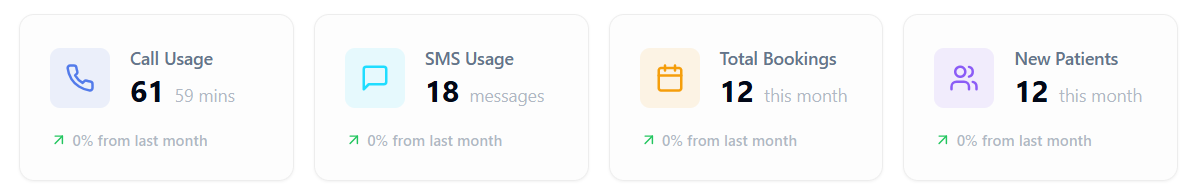
Call Usage
- Shows how many calls came in and went out this month.
- Also shows how long all those calls lasted in total.
- You'll see a little green arrow if it's gone up from last month.
SMS Usage
- This tells you how many text messages your AI agent has sent or received.
- Handy for checking how often it's following up or confirming things with patients.
Total Bookings
- How many appointments your AI agent has booked for you this month.
- A great way to see how much admin work DentalFlo is saving your team.
New Patients
- The number of first-time patients who've contacted your clinic this month.
- These are the folks your AI helped convert into actual bookings.
Call Distribution Graph
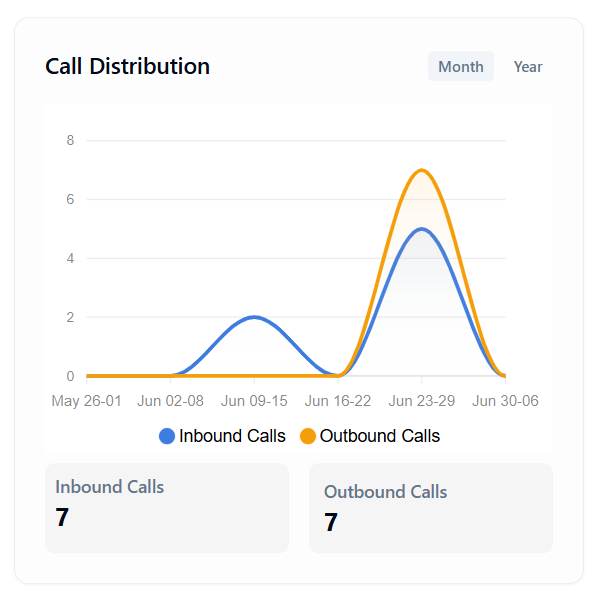
This chart shows how many inbound calls (patients calling you) and outbound calls (your AI calling patients) happened over time.
- Blue line = calls from patients.
- Orange line = calls made by your AI agent.
- You'll spot trends easily—like busy weeks or quieter times.
At the bottom, you'll see the total numbers for both inbound and outbound calls for the month.
SMS Trend Graph
This is just like the call chart—but for text messages.
- Orange line = texts your AI sent (like reminders or confirmations).
- Blue line = texts from patients (e.g. replies or appointment questions). You might not get many inbound texts, but outbound messages help your clinic stay connected without needing a team member to manually text.
Booking Trends
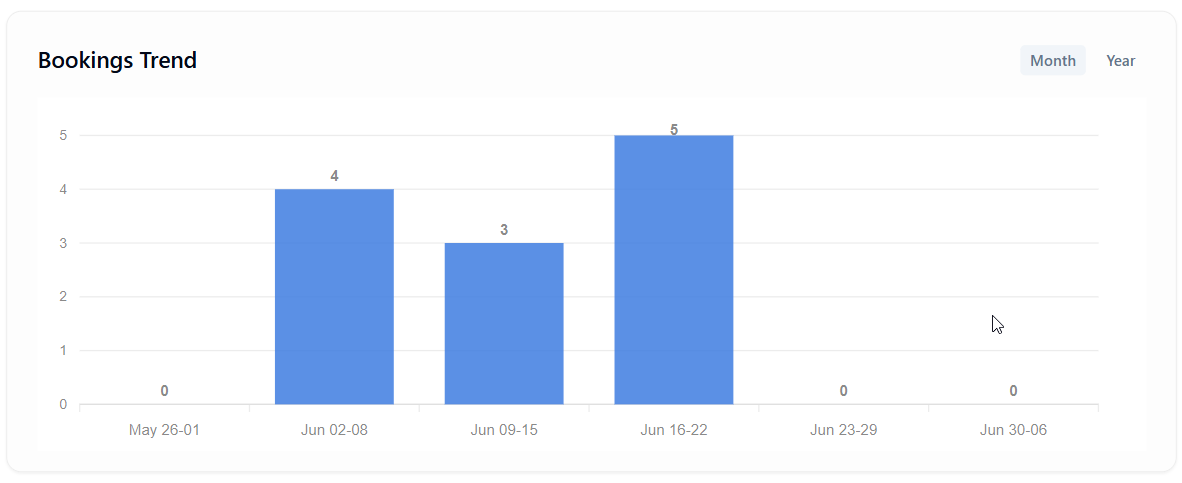
You'll find this chart further down. It shows how many appointments were booked through DentalFlo over the month. This helps you see:
- Which weeks were busiest
- Whether bookings are going up or down
- How well your AI agent is doing at capturing patient interest
What the Menu Icons Mean (Left Side)
Here’s a quick rundown of the buttons on the left-hand side:
- Dashboard – Where you are now
- Communications – See call logs and SMS messages
- Bookings – Appointment details and history
- Patients – Info about the patients your AI has interacted with
- Integrations – Connect DentalFlo with your Practice Management Software (like Core Practice or Dental4Windows)
- Billing/Payments – View charges or update your payment method
- Settings – Manage your clinic info, AI agent behaviour, hours, etc.
- Help – Access this guide or contact support
Helpful Tips
- Seeing zeros? Don’t worry—it just means there hasn't been any activity yet.
- No changes from last month? A green arrow with "0%" just means things stayed steady.
- Use the Month/Year toggle in the charts to view longer trends.
Need a Hand?
If anything on the dashboard looks confusing, or you'd like to get more out of DentalFlo, just reach out! You can contact our support team through the Help button, or email us at support@dentalfloai.com.au.
Remember: This dashboard isn't just for data—it's your clinic's way of seeing how DentalFlo is helping your team save time and serve patients better.